Rare Earths: Global Supply, Uses and Processing
MINERAL PROFILE / GLOBAL RESOURCE HUB
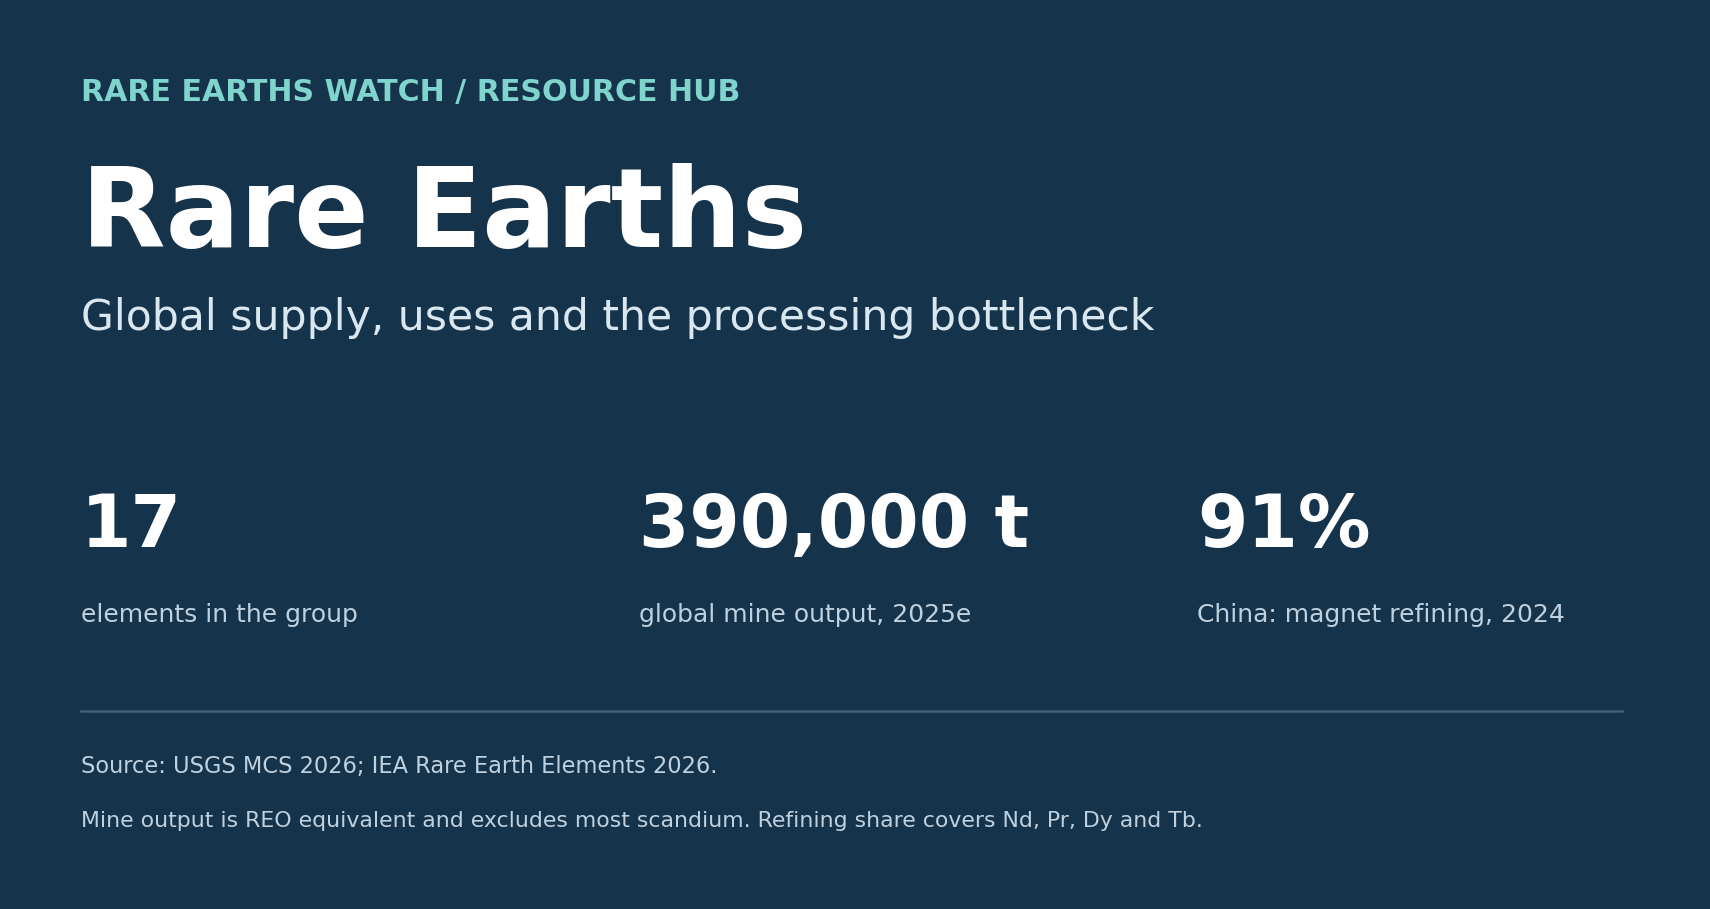
Rare earth supply depends on more than mineral deposits: processing, metal production and magnet manufacturing determine how mined material reaches industries across the global economy today.
The elements · Mine output · Processing · Global operations · Recycling · Sources
What rare earths are
Rare earths comprise the 15 lanthanides, plus yttrium and scandium. Their name can be misleading: several are relatively abundant in the Earth’s crust, while deposits that can be developed economically are much less common. The U.S. Geological Survey identifies bastnasite, monazite, loparite and ion-adsorption clays among important sources. A deposit’s mineralogy matters because extraction and treatment routes differ. Source: USGS overview.
For readers following electric vehicles, wind turbines and industrial motors, four elements deserve particular attention: neodymium, praseodymium, dysprosium and terbium. The IEA groups these as magnet rare earths. Neodymium and praseodymium provide the principal rare earth ingredients in NdFeB magnets; dysprosium and terbium can improve performance at high temperatures. Source: IEA.
Where rare earths are mined
| Selected producer | 2025 estimated output, tonnes REO equivalent |
|---|---|
| China | 270,000 |
| United States | 51,000 |
| Australia | 29,000 |
| Myanmar (Burma) | 22,000 |
| Thailand | 4,800 |
| India | 2,900 |
| Madagascar | 2,700 |
| Russia | 2,600 |
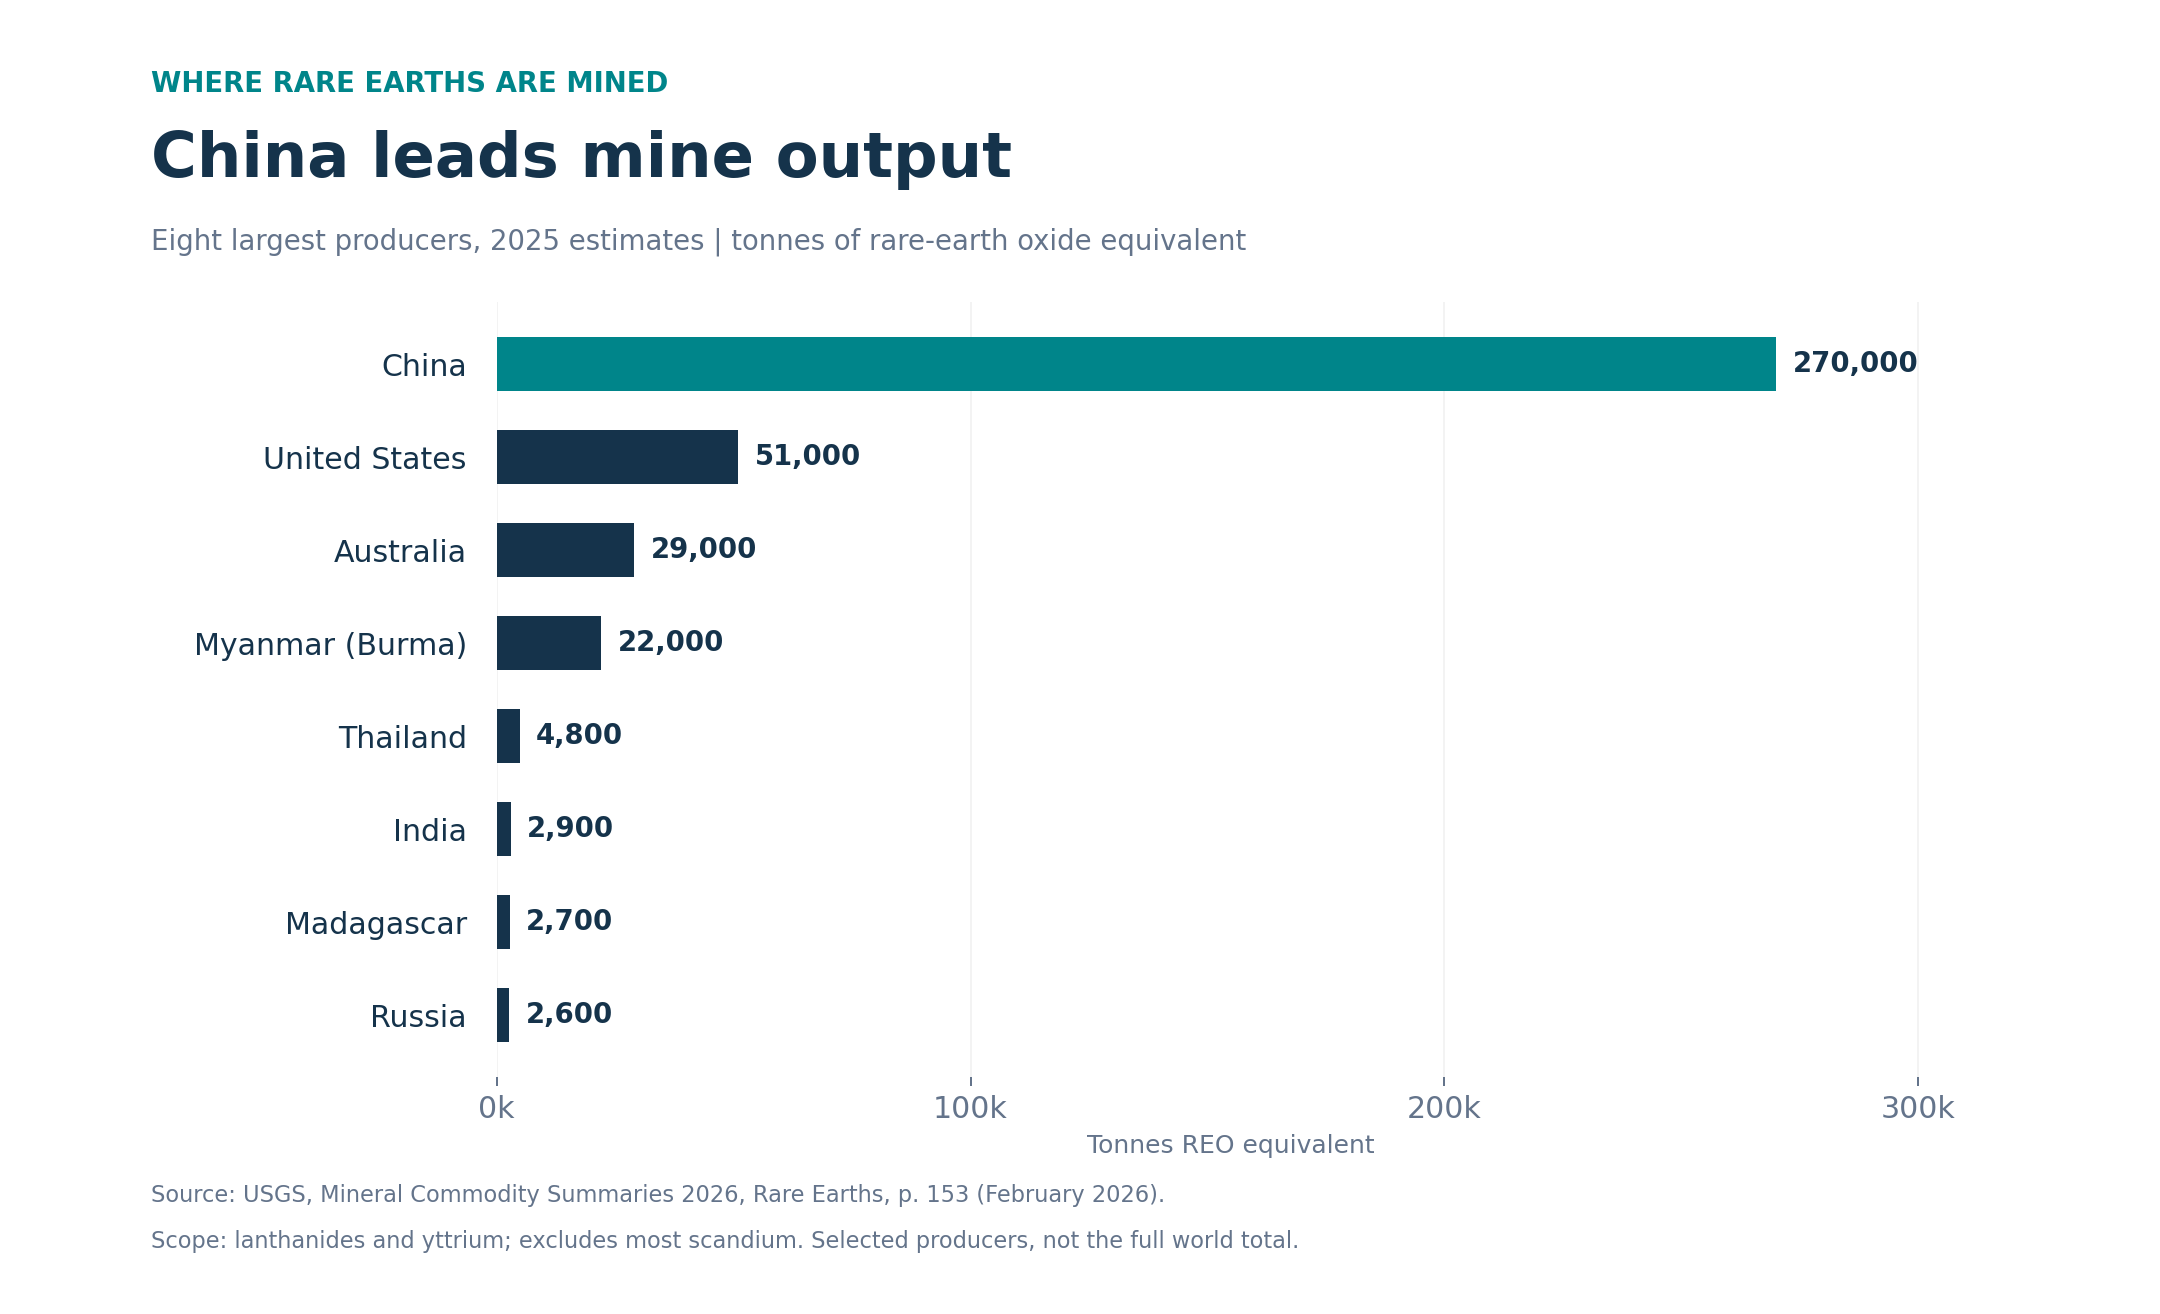
USGS estimates world mine output at 390,000 tonnes in 2025. This series covers lanthanides and yttrium and excludes most scandium. The table shows the eight largest producers, not the full world total. Some country estimates use Chinese import statistics. Download the original USGS table.
From mine to magnet: the processing bottleneck
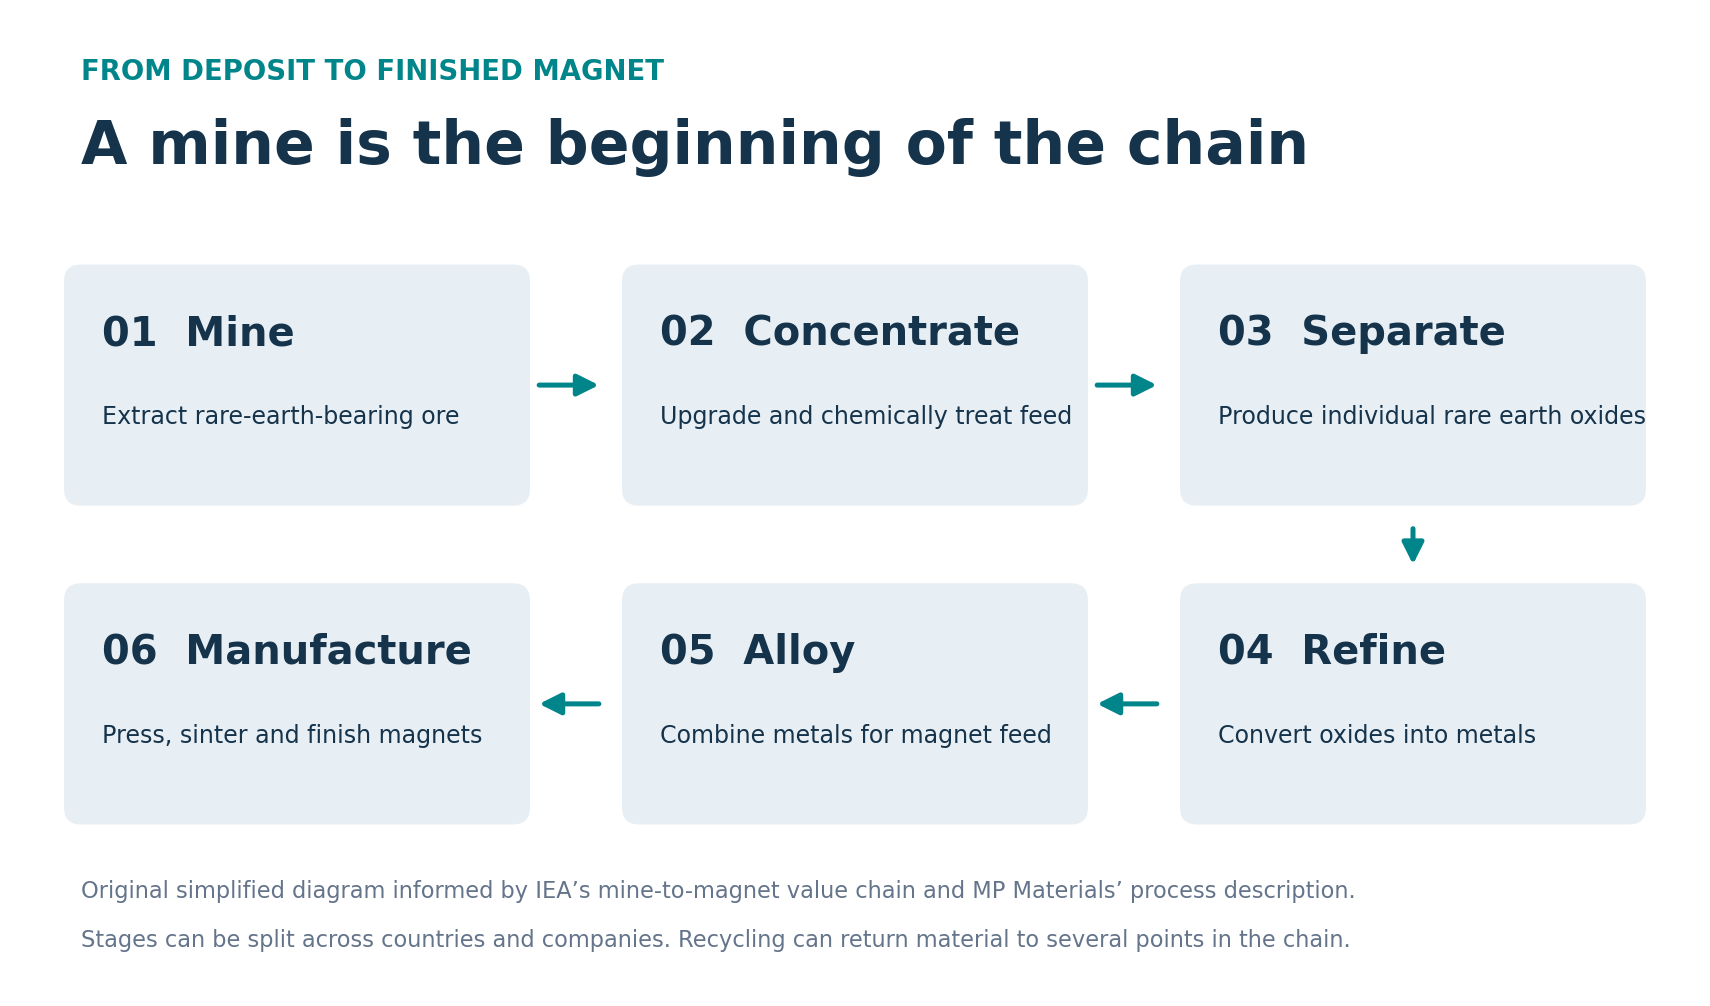
A mining announcement establishes only one part of a supply chain. Concentrate must be treated, individual elements separated, oxides converted into metals and metals alloyed before magnets can be manufactured. This sequence explains why a country can produce ore while depending on processing elsewhere. The diagram is a simplified guide rather than a universal plant design. MP Materials describes its metal, alloy and magnet production processes here.
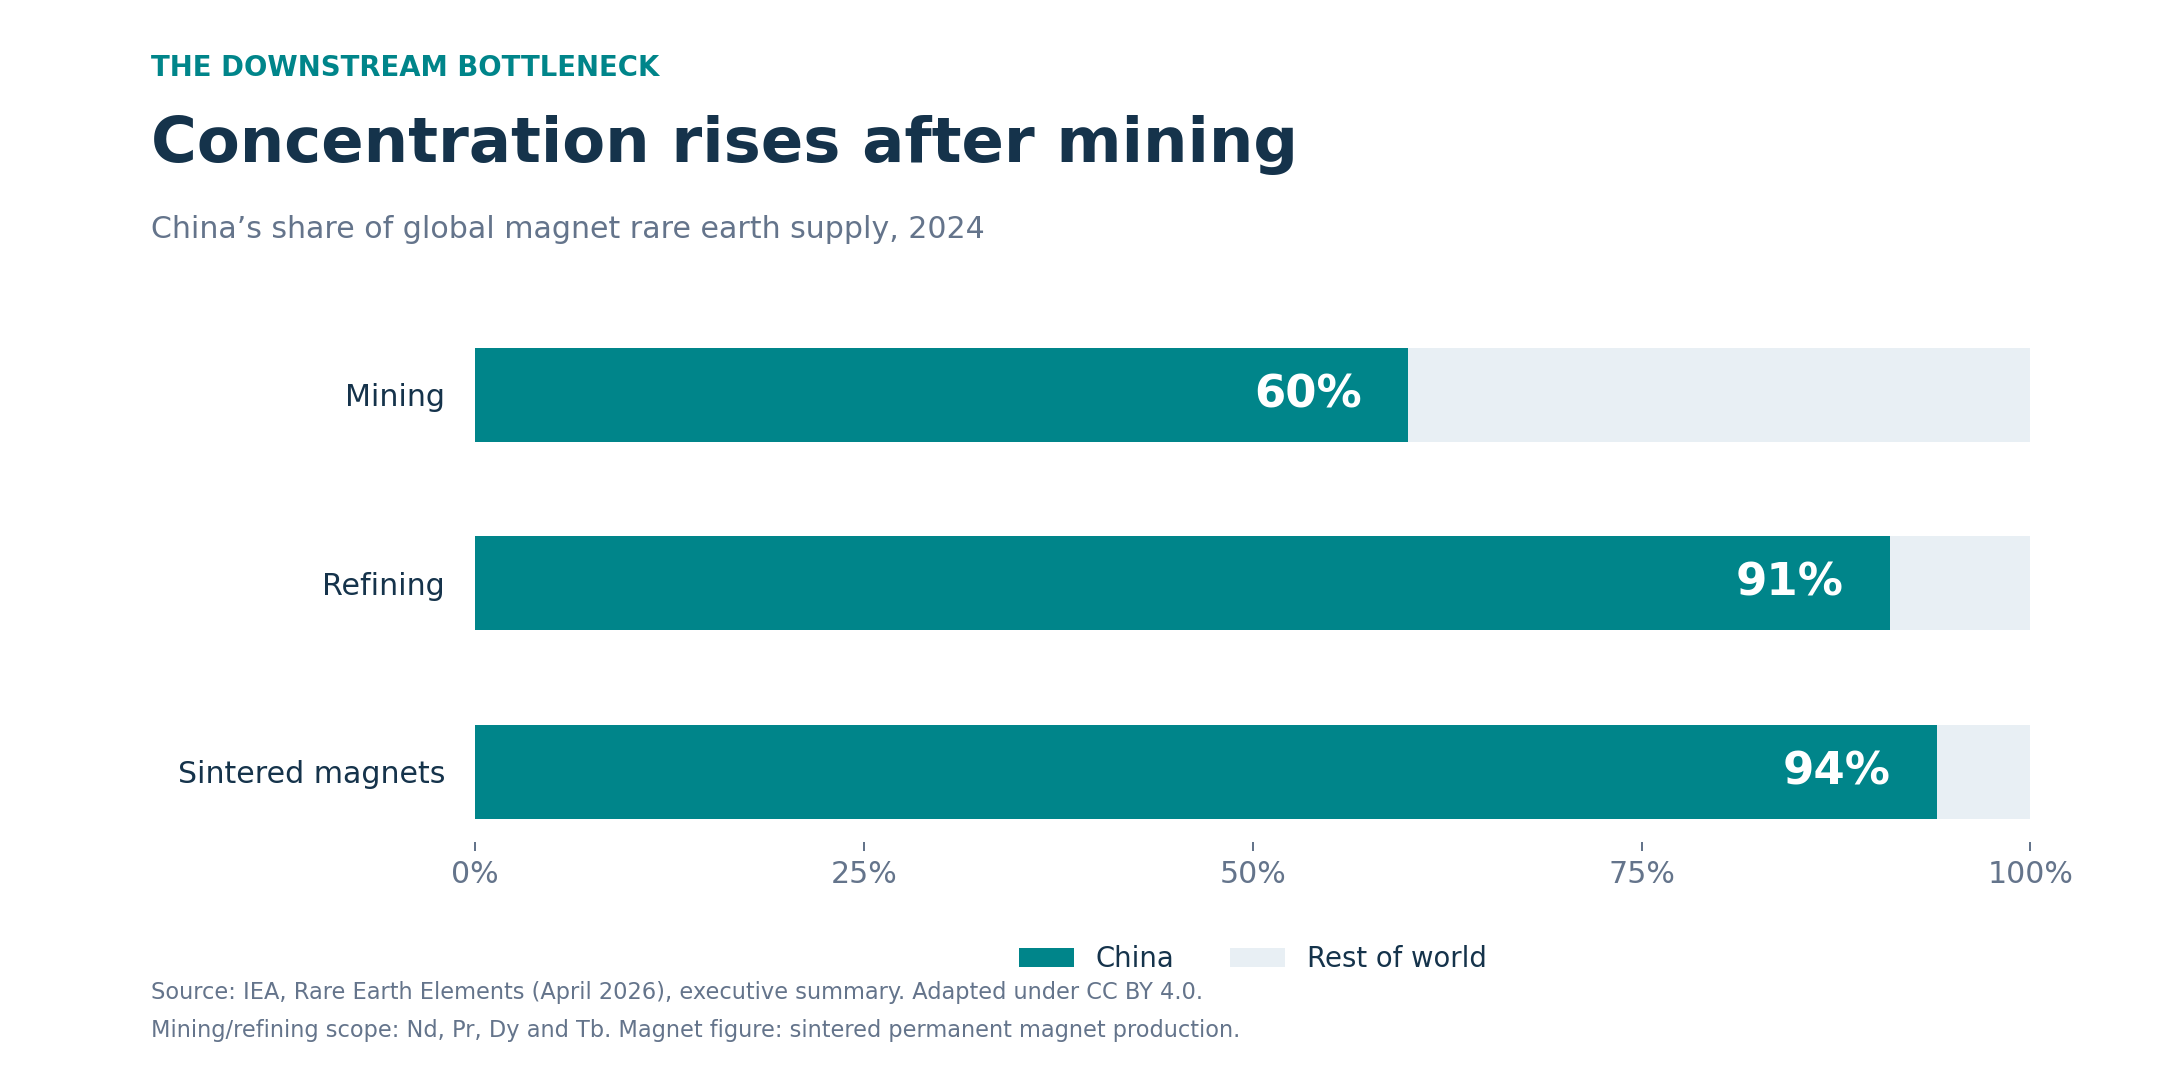
The IEA’s 2024 shares show concentration increasing downstream: China accounted for 60% of magnet rare earth mining, 91% of refining and 94% of sintered permanent magnet production. This narrower element coverage differs from the USGS mine-output series above. The two charts should therefore be read separately. Source: IEA executive summary.
A global view of operations and development
The examples below show different stages of the chain. They are a starting point for the hub’s project tracker, rather than an exhaustive company ranking. Company descriptions establish an operation’s role; they do not substitute for audited annual output. An announced refinery or magnet plant should remain separate from operating production until commissioning and commercial output are documented.
| Organization / geography | Role and evidence | How to classify it |
|---|---|---|
| Lynas / Australia and Malaysia | Mt Weld mining and Malaysian separation footprint. Company source. | Record mining and separation separately. |
| MP Materials / United States | Independence facility in Fort Worth processes rare earths into metals, alloys and NdFeB magnets. Company source. | Downstream manufacturing; verify output by reporting period. |
| Iluka / Western Australia | Eneabba refinery development, with provision for third-party feed. Project source. | Under development; exclude planned capacity from current output. |
| IREL / India | Monazite-derived oxides, samarium-cobalt magnet activity and recycling initiatives. Government source. | Distinguish oxides, SmCo magnets and proposed NdFeB expansion. |
Recycling and alternative supply
Recycling adds another route into the supply chain, but collection and material recovery are separate challenges. Magnets may first need to be identified and removed from complex products. Their composition, coatings and condition influence the next processing step. The European Union-backed REEPRODUCE project reports pilot work spanning collection, dismantling and recovery. Its demonstrations should be recorded as pilot activity, with commercial scale-up tracked separately. Source: European Commission CORDIS project reporting.
For this hub, a useful recycling record should identify the feedstock, process, recovered product and operating status. A plant handling manufacturing scrap cannot automatically be compared with one recovering magnets from discarded equipment. Record the denominator behind a recovery percentage and whether it represents laboratory tests, a pilot campaign or sustained commercial operation. These distinctions make the database more useful as additional projects are added.
Sources, definitions and updates
Every numerical entry should retain its reference year, unit and source link. REO means rare-earth oxide equivalent; it is not the weight of finished magnets. Estimated data should retain their estimate flag. Missing values should remain unavailable rather than becoming zero. New company capacity should enter the project tracker with a status and evidence date, followed by a separate production record when output is reported.
This profile uses the USGS February 2026 mine-output table and the IEA April 2026 rare earth report as statistical baselines. The review date indicates when the page was checked; it does not change the reference years of those datasets. Graphics are original compositions built from the cited data, with attribution and license information retained for IEA material.
Data methodology and entry standards · Sources and data directory · Return to the global resource hub