Copper: Global Supply, Refining and Electrification
MINERAL PROFILE / GLOBAL RESOURCE HUB
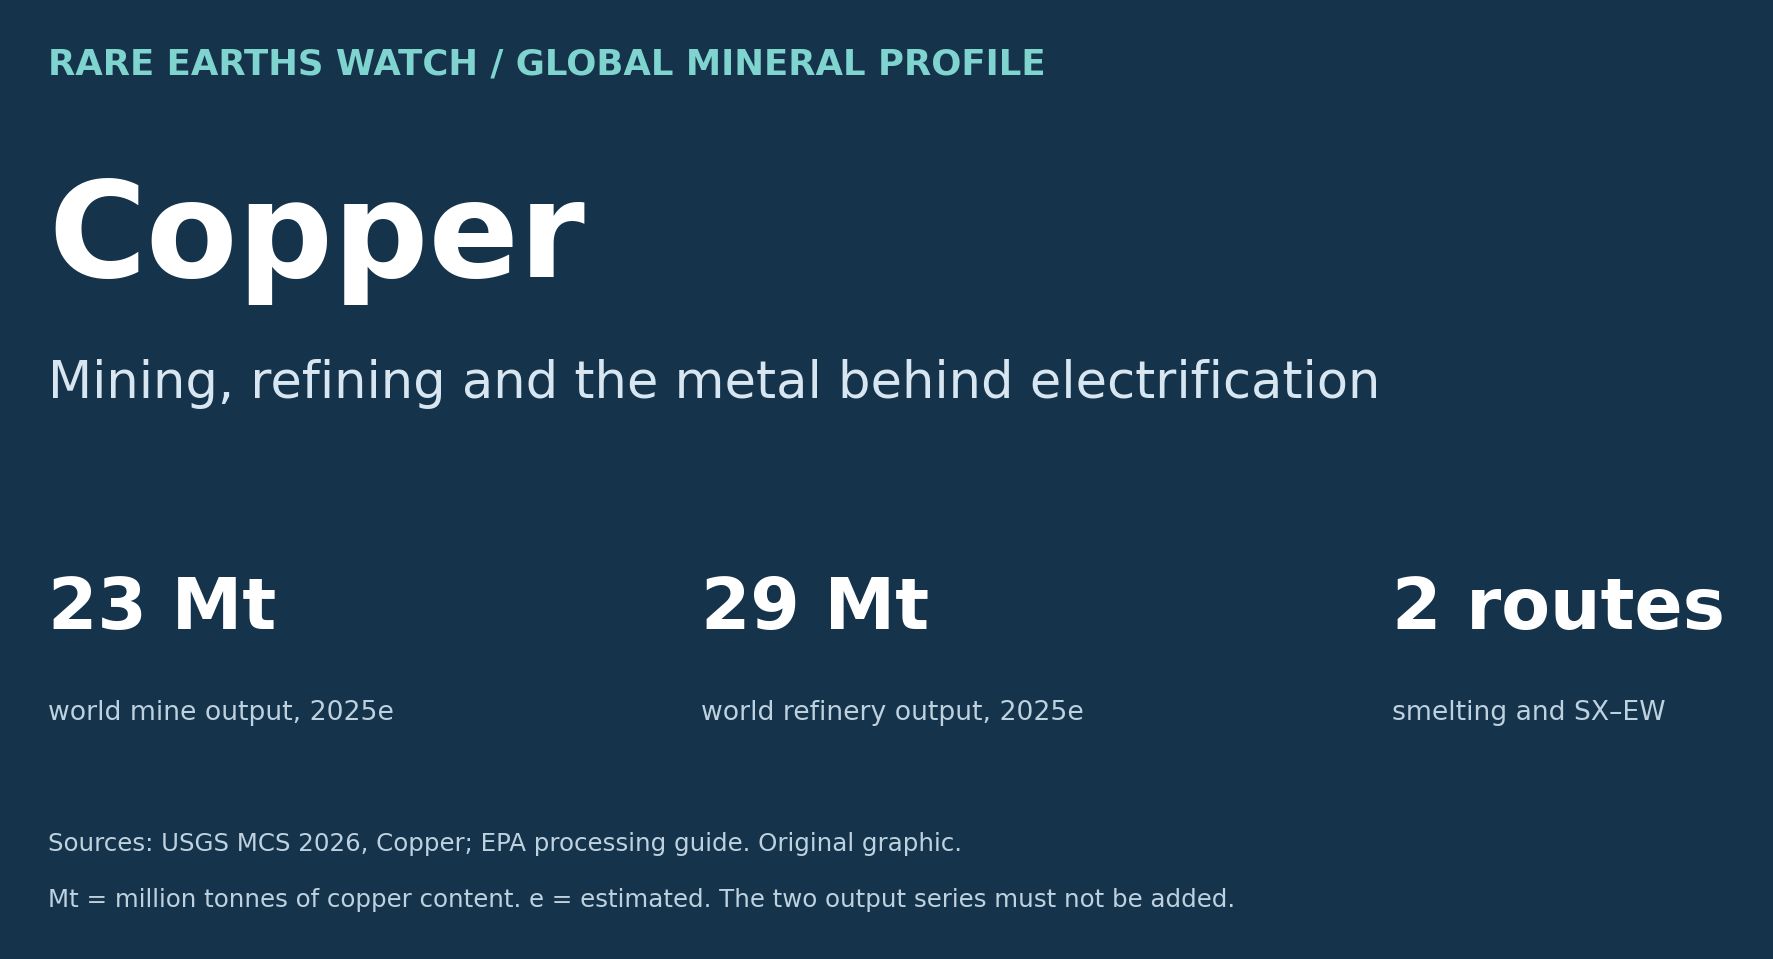
Copper connects power grids, transport and industry, but mine production, smelting, refining and recycling reveal different supply dependencies across the global economy and its industrial regions.
Cover: original Rare Earths Watch graphic using USGS production data and EPA process guidance.
Uses · Mining · Refining · Processing · Recycling · Sources
Why copper matters to electrification
Copper’s electrical conductivity and resistance to corrosion make it important to grids, vehicles, buildings, industry and data centers. The International Energy Agency identifies electrification as a source of demand growth while highlighting the difficulty of bringing new mines into production. Its March 2026 assessment points to lower ore grades, rising capital costs and long development periods as constraints. These are reasons to examine the project pipeline, rather than assume that higher prices immediately deliver new supply. Source: IEA, March 2, 2026.
Where copper is mined
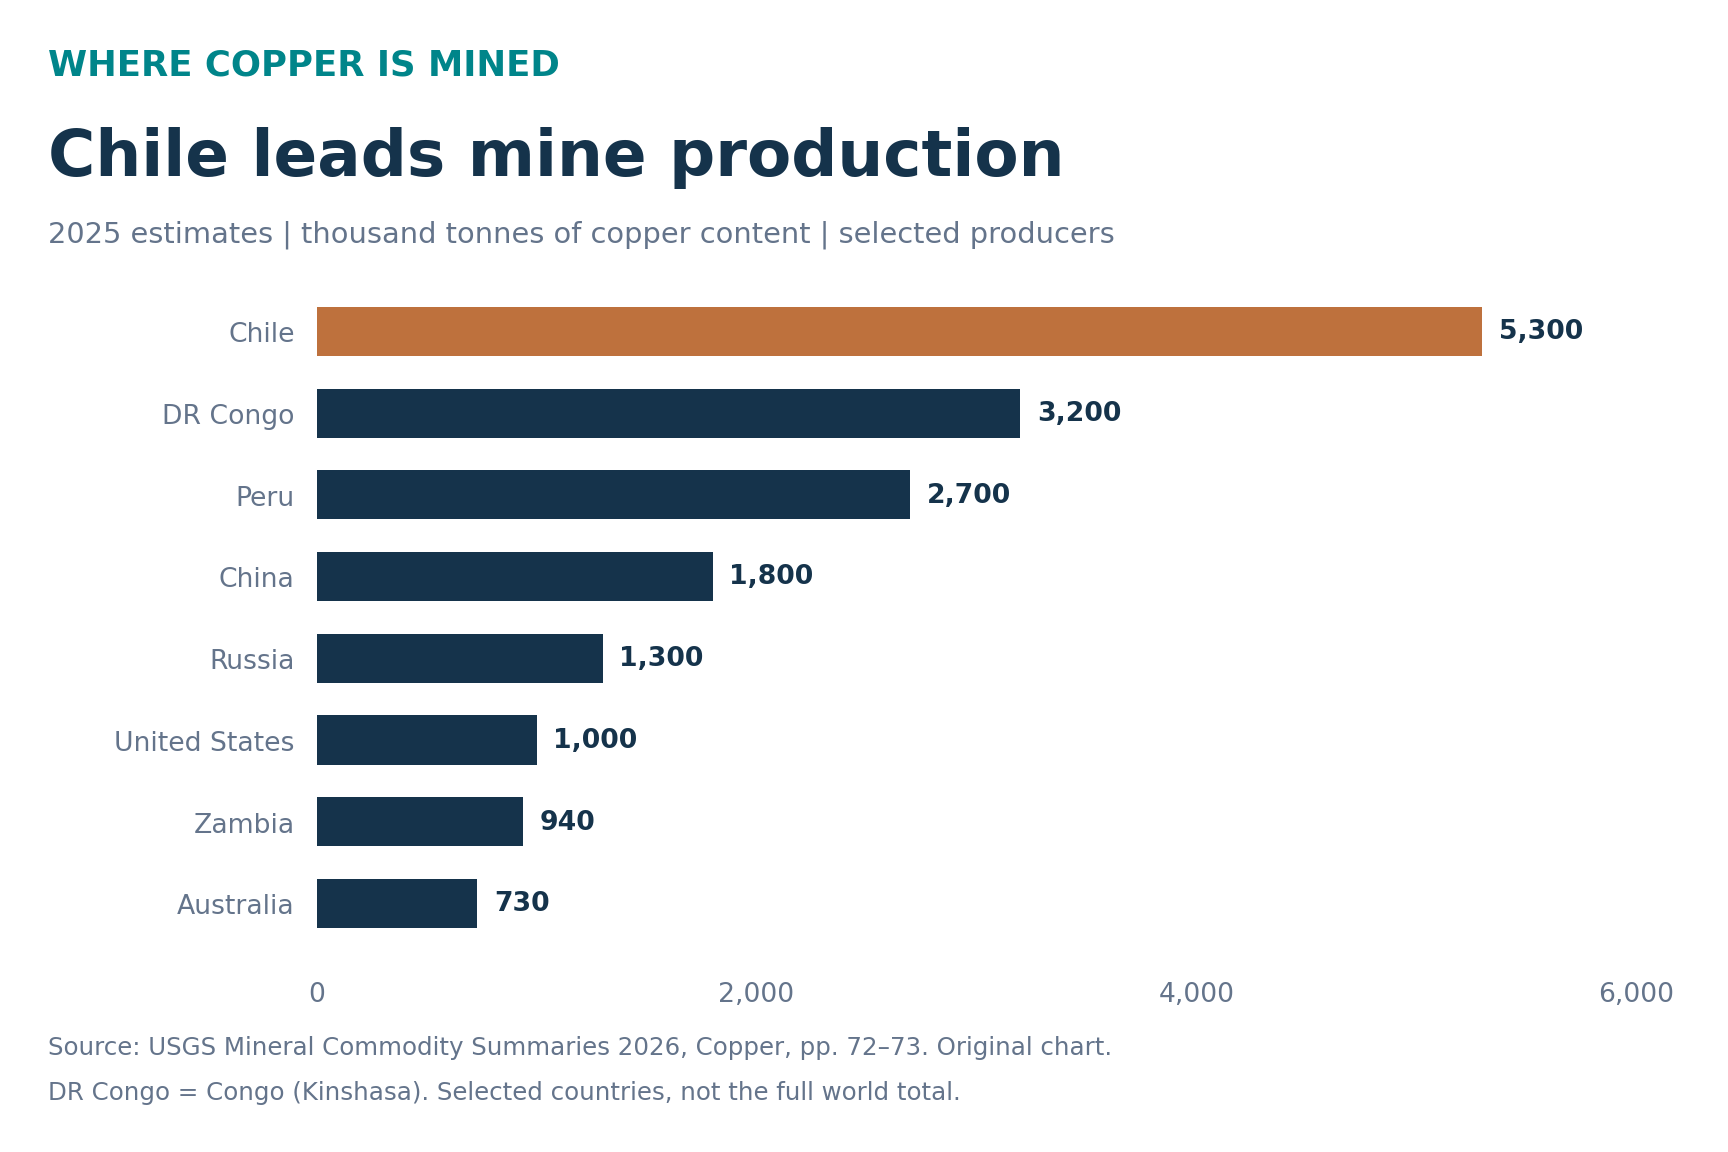
USGS estimates world mine output at 23 million tonnes of copper content in 2025. The chart presents selected producers. Original production table and footnotes.
Mining and refining are different measures
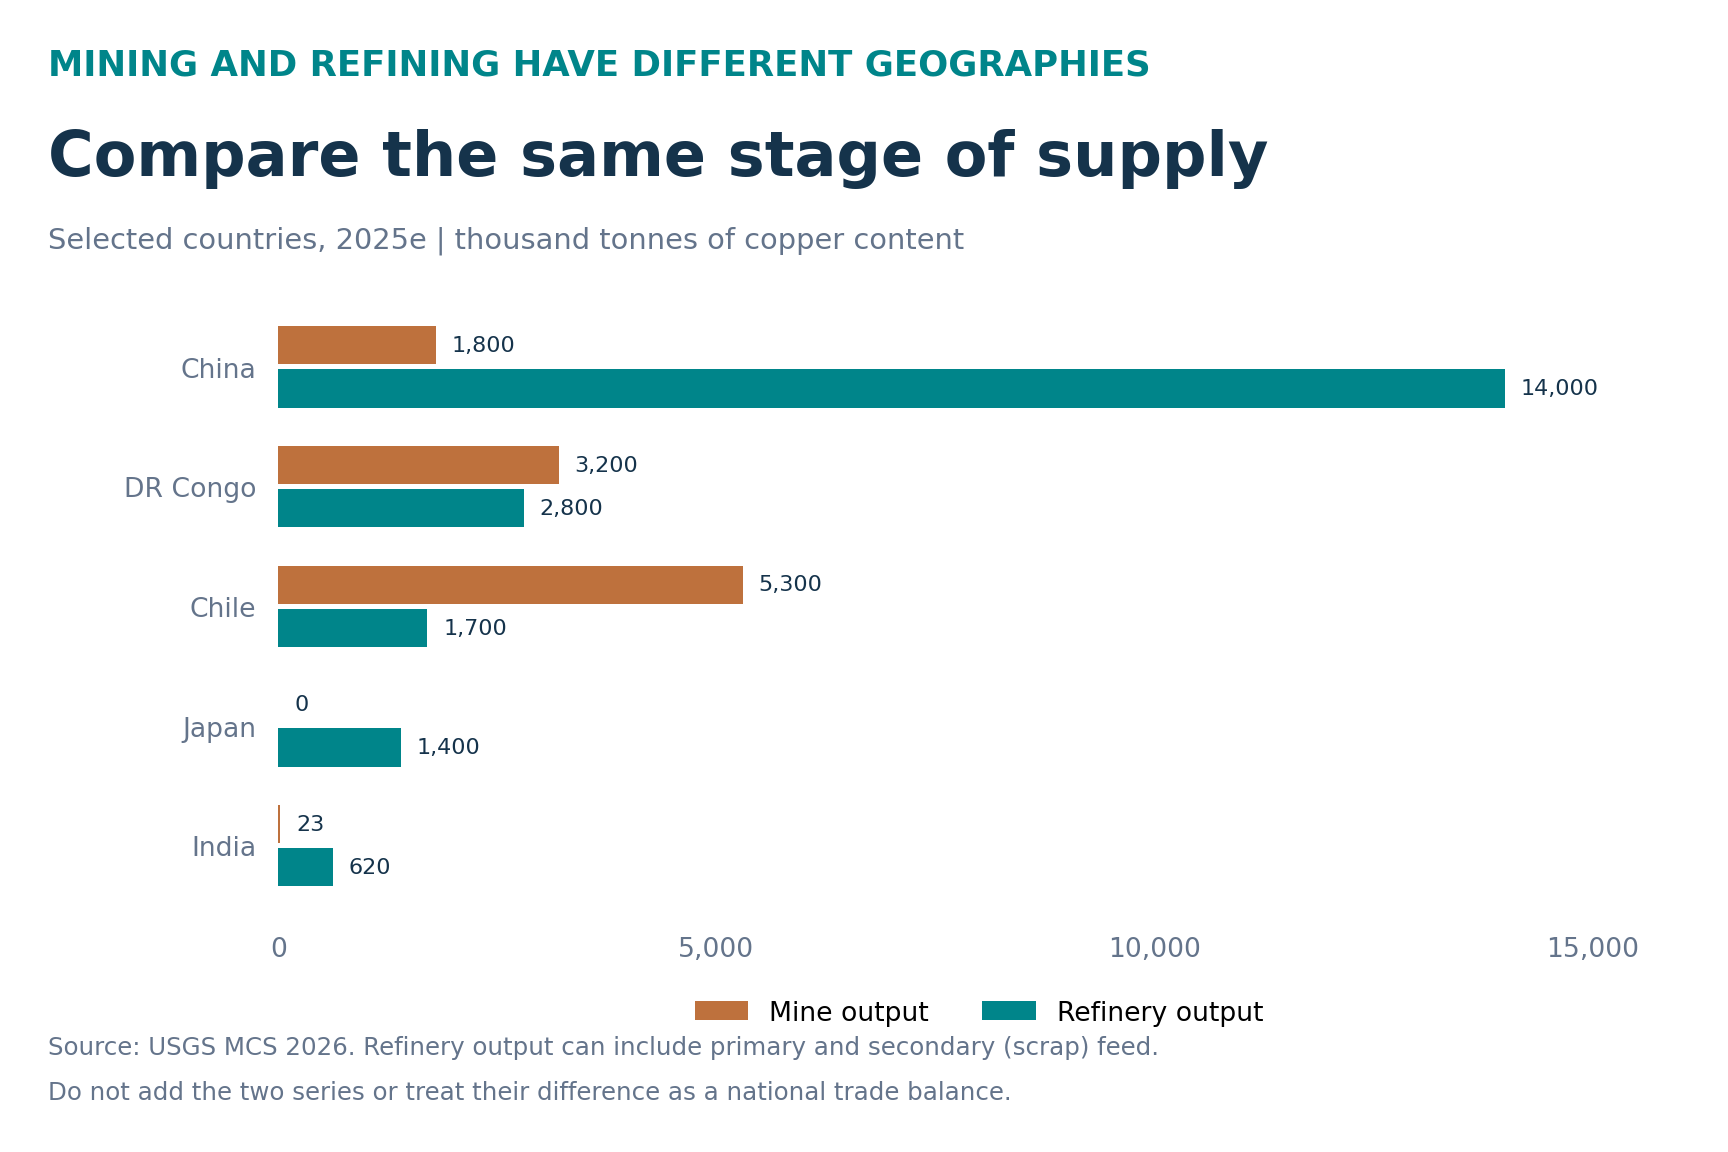
| Selected country | Mine output, 2025e | Refinery output, 2025e |
|---|---|---|
| China | 1,800 | 14,000 |
| DR Congo | 3,200 | 2,800 |
| Chile | 5,300 | 1,700 |
| Japan | 0 | 1,400 |
| India | 23 | 620 |
Units: thousand tonnes, copper content. World refinery output is estimated at 29 million tonnes. Refinery supply includes primary and secondary material. Source: USGS.
The midstream also has its own economics. The IEA explains that smelters compete for concentrate and receive treatment and refining charges, while by-products and product premiums can affect revenue. A high copper price therefore does not guarantee strong smelter margins. Company coverage should identify whether an operation is integrated with mines or purchases feed from the market. Source: IEA.
Two main routes to refined copper
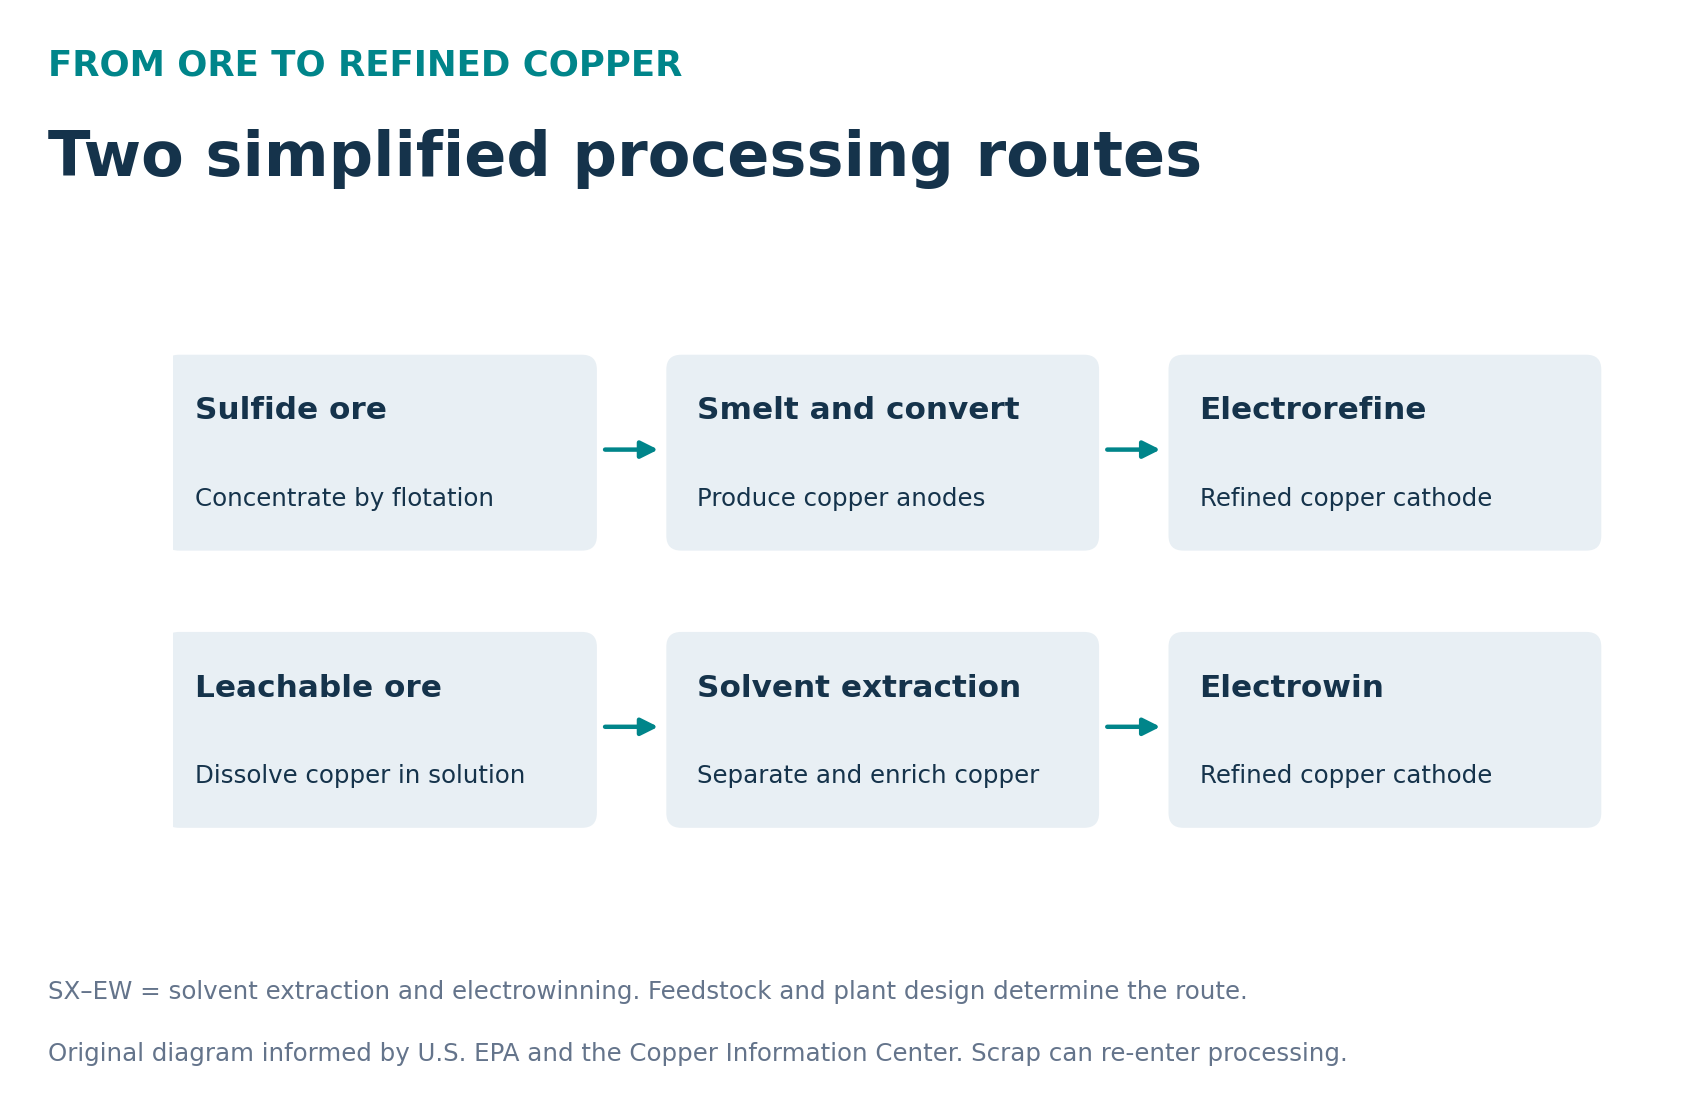
Sulfide ores commonly move through concentration, smelting and refining. A second route recovers copper from suitable ores through leaching, solvent extraction and electrowinning, usually abbreviated SX–EW. The Copper Information Center explains that both can produce high-purity cathode. Scrap follows different paths according to its quality: some material requires smelting and refining, while suitable high-grade scrap can go directly to fabricators. Source: Copper Information Center.
| Term | Meaning | Comparison rule |
|---|---|---|
| Ore and concentrate | Feed materials that contain copper alongside other minerals. | Retain copper grade and distinguish gross weight from metal content. |
| Cathode | Refined copper product. | Compare the same product, purity and reporting period. |
| Smelter or refinery capacity | Designed processing capability. | Separate nameplate capacity from achieved output. |
| Secondary production | Copper recovered through processing scrap. | Check whether it is already included in a reported refinery total. |
Environmental coverage should follow the process as well as the deposit. EPA describes waste rock, tailings and leach residues, and notes that exposed sulfide minerals can generate acid drainage under suitable conditions. A project record should therefore link to its environmental assessment, water-management plan and waste-storage arrangements. Those documents offer a more useful basis for comparison than a general claim that one extraction route is always preferable. Source: U.S. EPA.
Recycling complements primary supply
The International Copper Study Group describes recycling as a complement to primary production. Copper can retain its useful properties through recycling, but different recycling indicators answer different questions. The recycling input rate measures the share of metal and products produced from scrap. It should not be confused with the proportion of discarded products collected or the recovery achieved at a particular plant. Source: ICSG recycling guide.
For the hub, recycling entries should identify the feedstock, collection boundary, recovered product and reporting period. Manufacturing offcuts, demolition material and end-of-life electronics are different streams. Preserve those distinctions so that a plant’s recovery claim is not presented as an economy-wide recycling rate. Annual throughput, copper content and saleable output should each have their own field.
India within the global supply chain
India illustrates the importance of tracking stages separately. Hindustan Copper describes its current focus as exploration, mining and beneficiation to produce concentrate, with mines at Malanjkhand, Khetri and Ghatsila. Its company profile says the Ghatsila and Jhagadia smelting and refining facilities have been suspended since 2019. An asset list is therefore not enough to establish operating production. Source: Hindustan Copper company profile.
Evidence and update standards
This profile establishes a dated baseline for the global hub. Country pages and project records should retain the source, calendar or fiscal year, unit, product and operating status. Estimates must keep their estimate flag; unavailable data should remain unavailable. Exploration results, reserves, construction schedules and annual output belong in separate fields.
Future market updates should distinguish exchange prices for refined metal from concentrate terms and physical premiums. Record the quotation date, currency, delivery basis and product specification. The review date on this page does not turn the historical production estimates into current-year results.